The “Filtration” tab enables users to apply up to eight selection criteria from menus organized into four categories: General information, Transcriptomic and proteomic data, Annotation data and Search your own proteins. In the former category, the user can select candidates according to:
- (i) the neXtProt database release;
- (ii) the chromosome location provided by neXtProt;
- (iii) the neXtProt protein existence (PE) status; and,
- (iv) the observability status (ranging from “observable” to “unobservable”) (Farrah et al., 2013).
In the Transcriptomic and proteomic data category, PepPSy allows users to filter candidate gene products based on (v) their presence in six distinct transcriptomic and proteomic datasets including: the NCBI UniGene/EST dataset (45 human experimental conditions (HECs), such as tissues, organs or cell types); an Affymetrix 3' Gene array dataset (109 HECs) (Britto et al., 2012); an Affymetrix All Exon array dataset containing 12 human tissues (raw data available on manufacturer's < href="http://www.affymetrix.com/support/technical/sample_data/exon_array_data.affx">website); the Illumina RNA-sequencing dataset (32 HECs) of the Human Protein Atlas (HPA) database (Uhlen et al., 2015); the antibody-based protein expression profiling (83 HECs) of HPA (Uhlen et al., 2015); and a LC/MS-based protein expression profiling (30 HECs) (Kim et al., 2014).
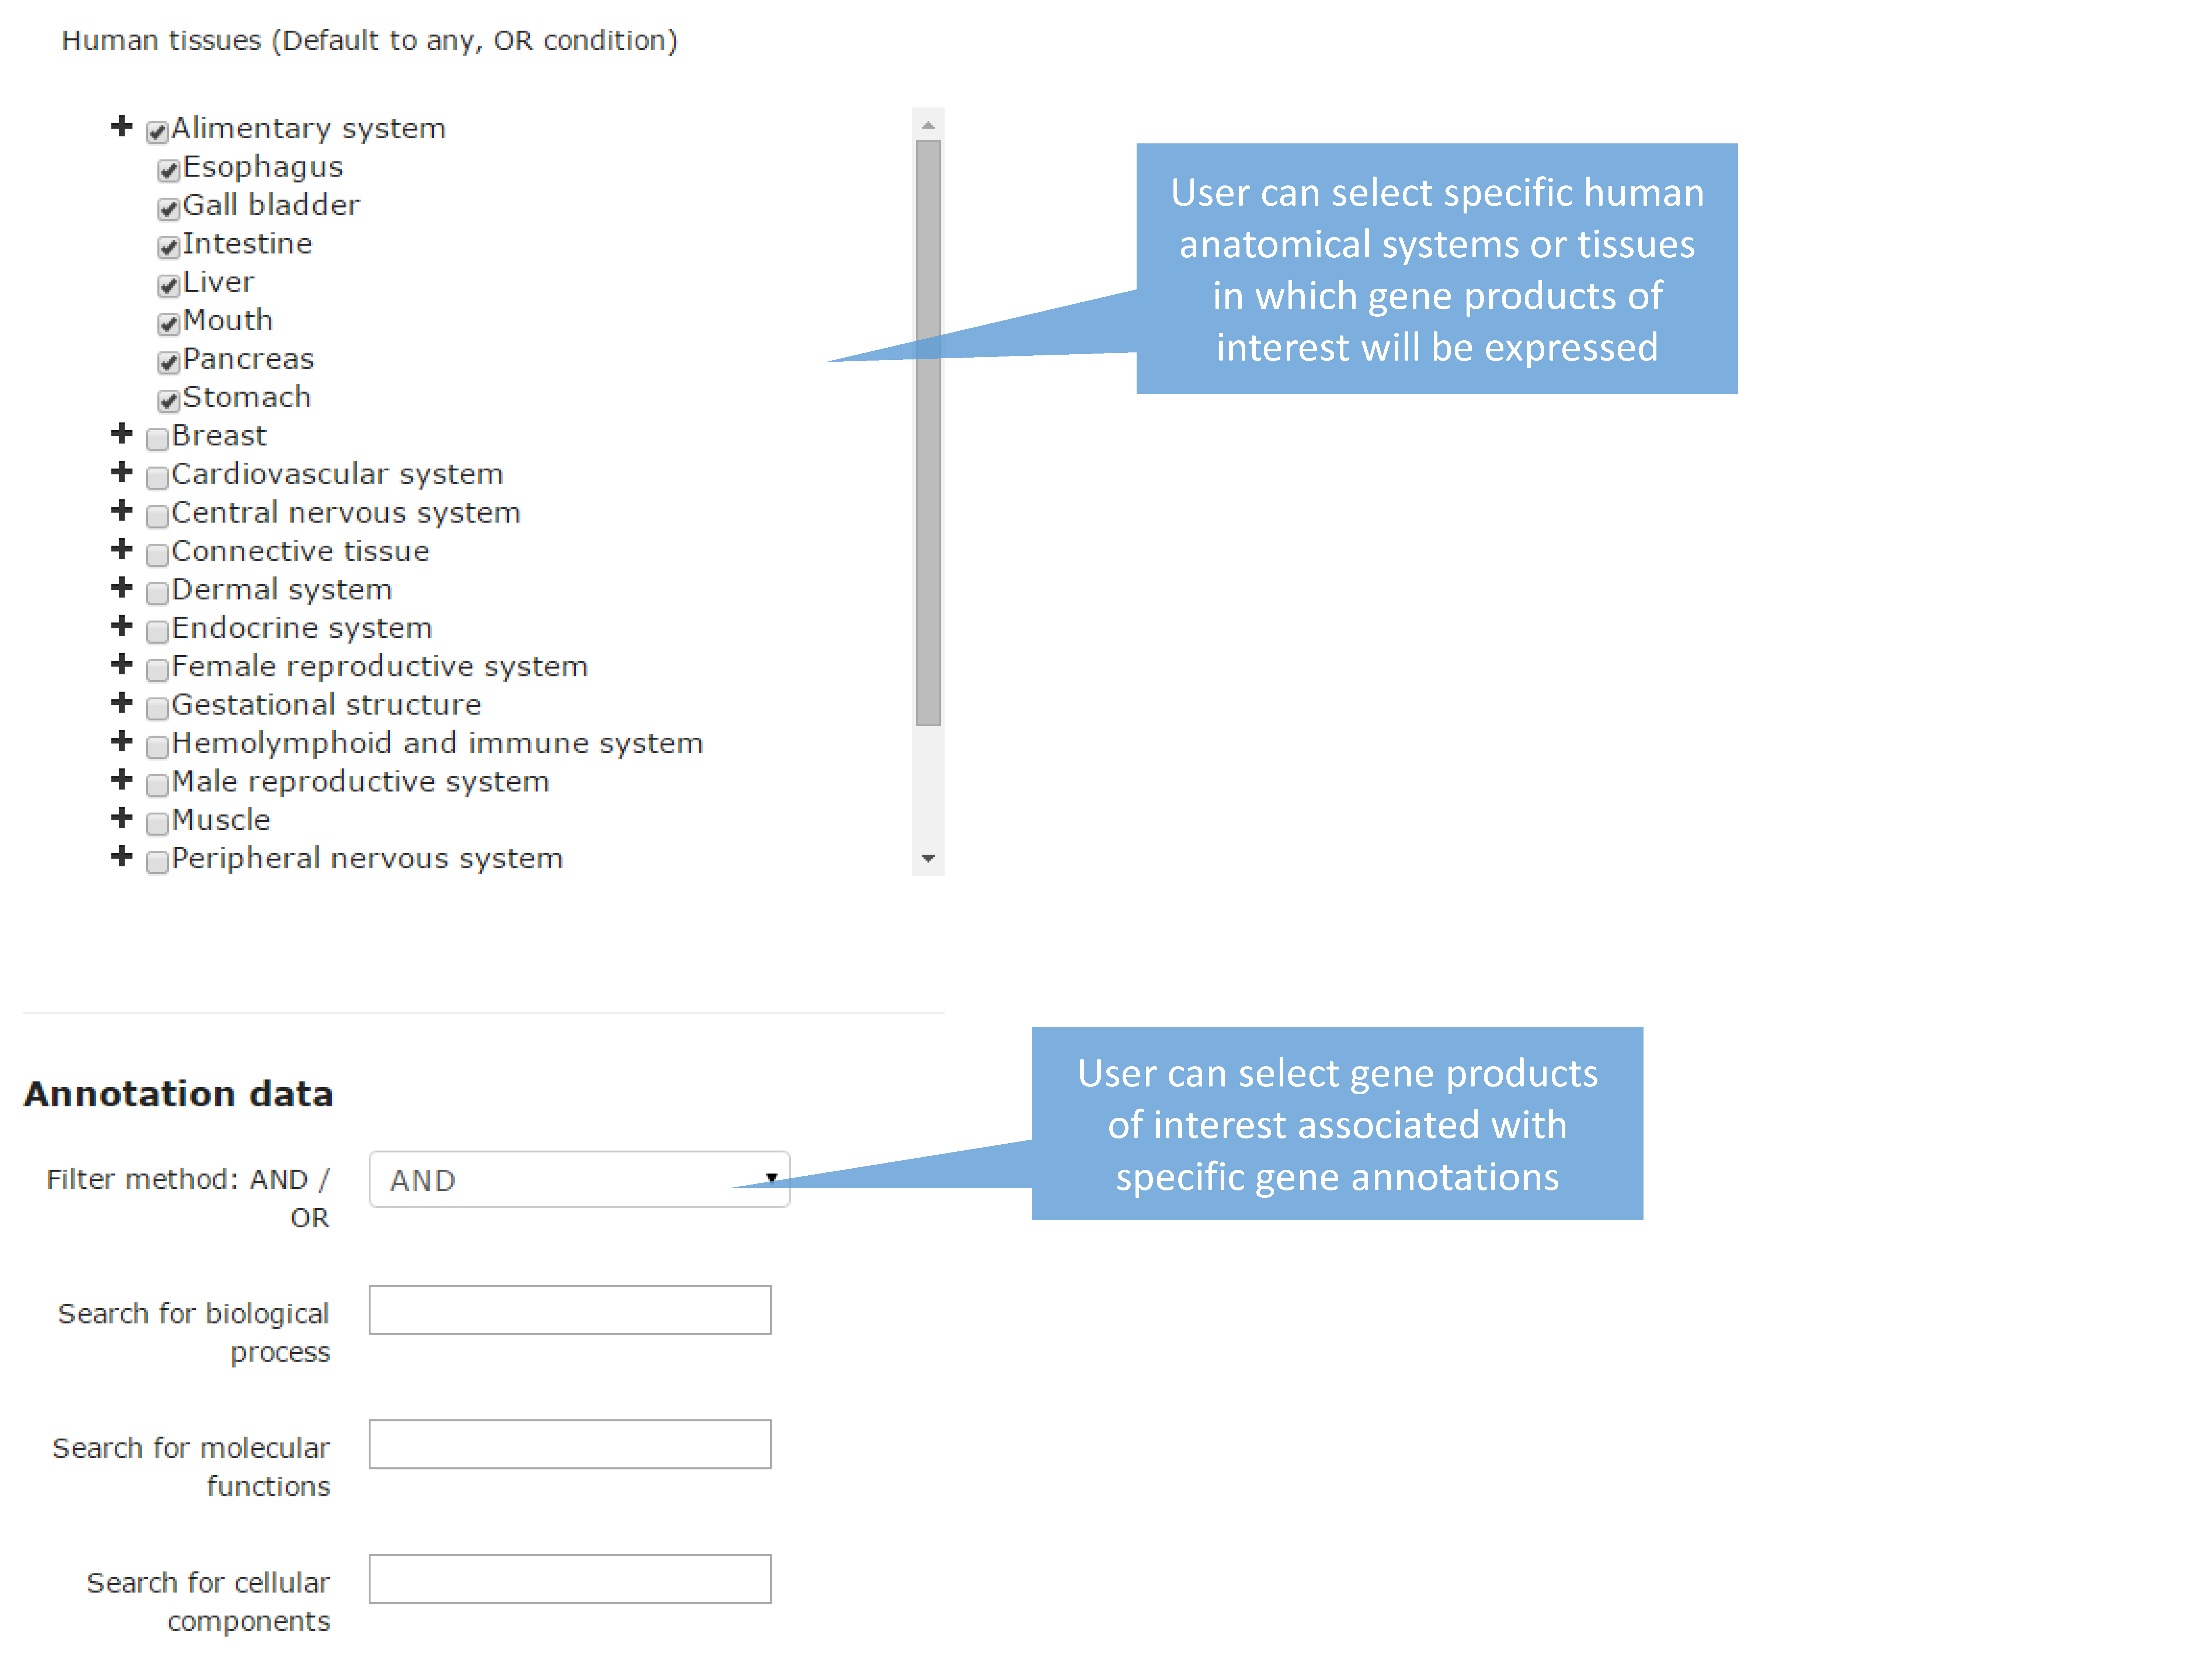
One can also directly select candidates expressed in (vi) specific anatomical systems or tissues. In the corresponding menu, HECs that are analyzed in at least one of the 6 transcriptomic and proteomic datasets are classified using the human anatomy ontology provided by the neXtProt platform. Briefly, the menu contains 2 levels in which 60 human tissues/organs (level 2) are classified in 17 major systems of the human body (level 1).

The Annotation data category allows users to select candidates according to (vii) their associated annotations including biological process, molecular function and cellular component GO terms (Huntley et al., 2014) as provided by neXtProt (Gaudet et al., 2015). Finally, (viii) a custom list of gene products can be queried using the text field of the latter category termed “Search your own proteins”. Currently, PepPSy only accepts neXtProt and NCBI’s Entrez Gene identifiers as well as gene symbols. For other database entry conversions, users are referred to the UniProt's online conversion service (Pundir et al., 2015).
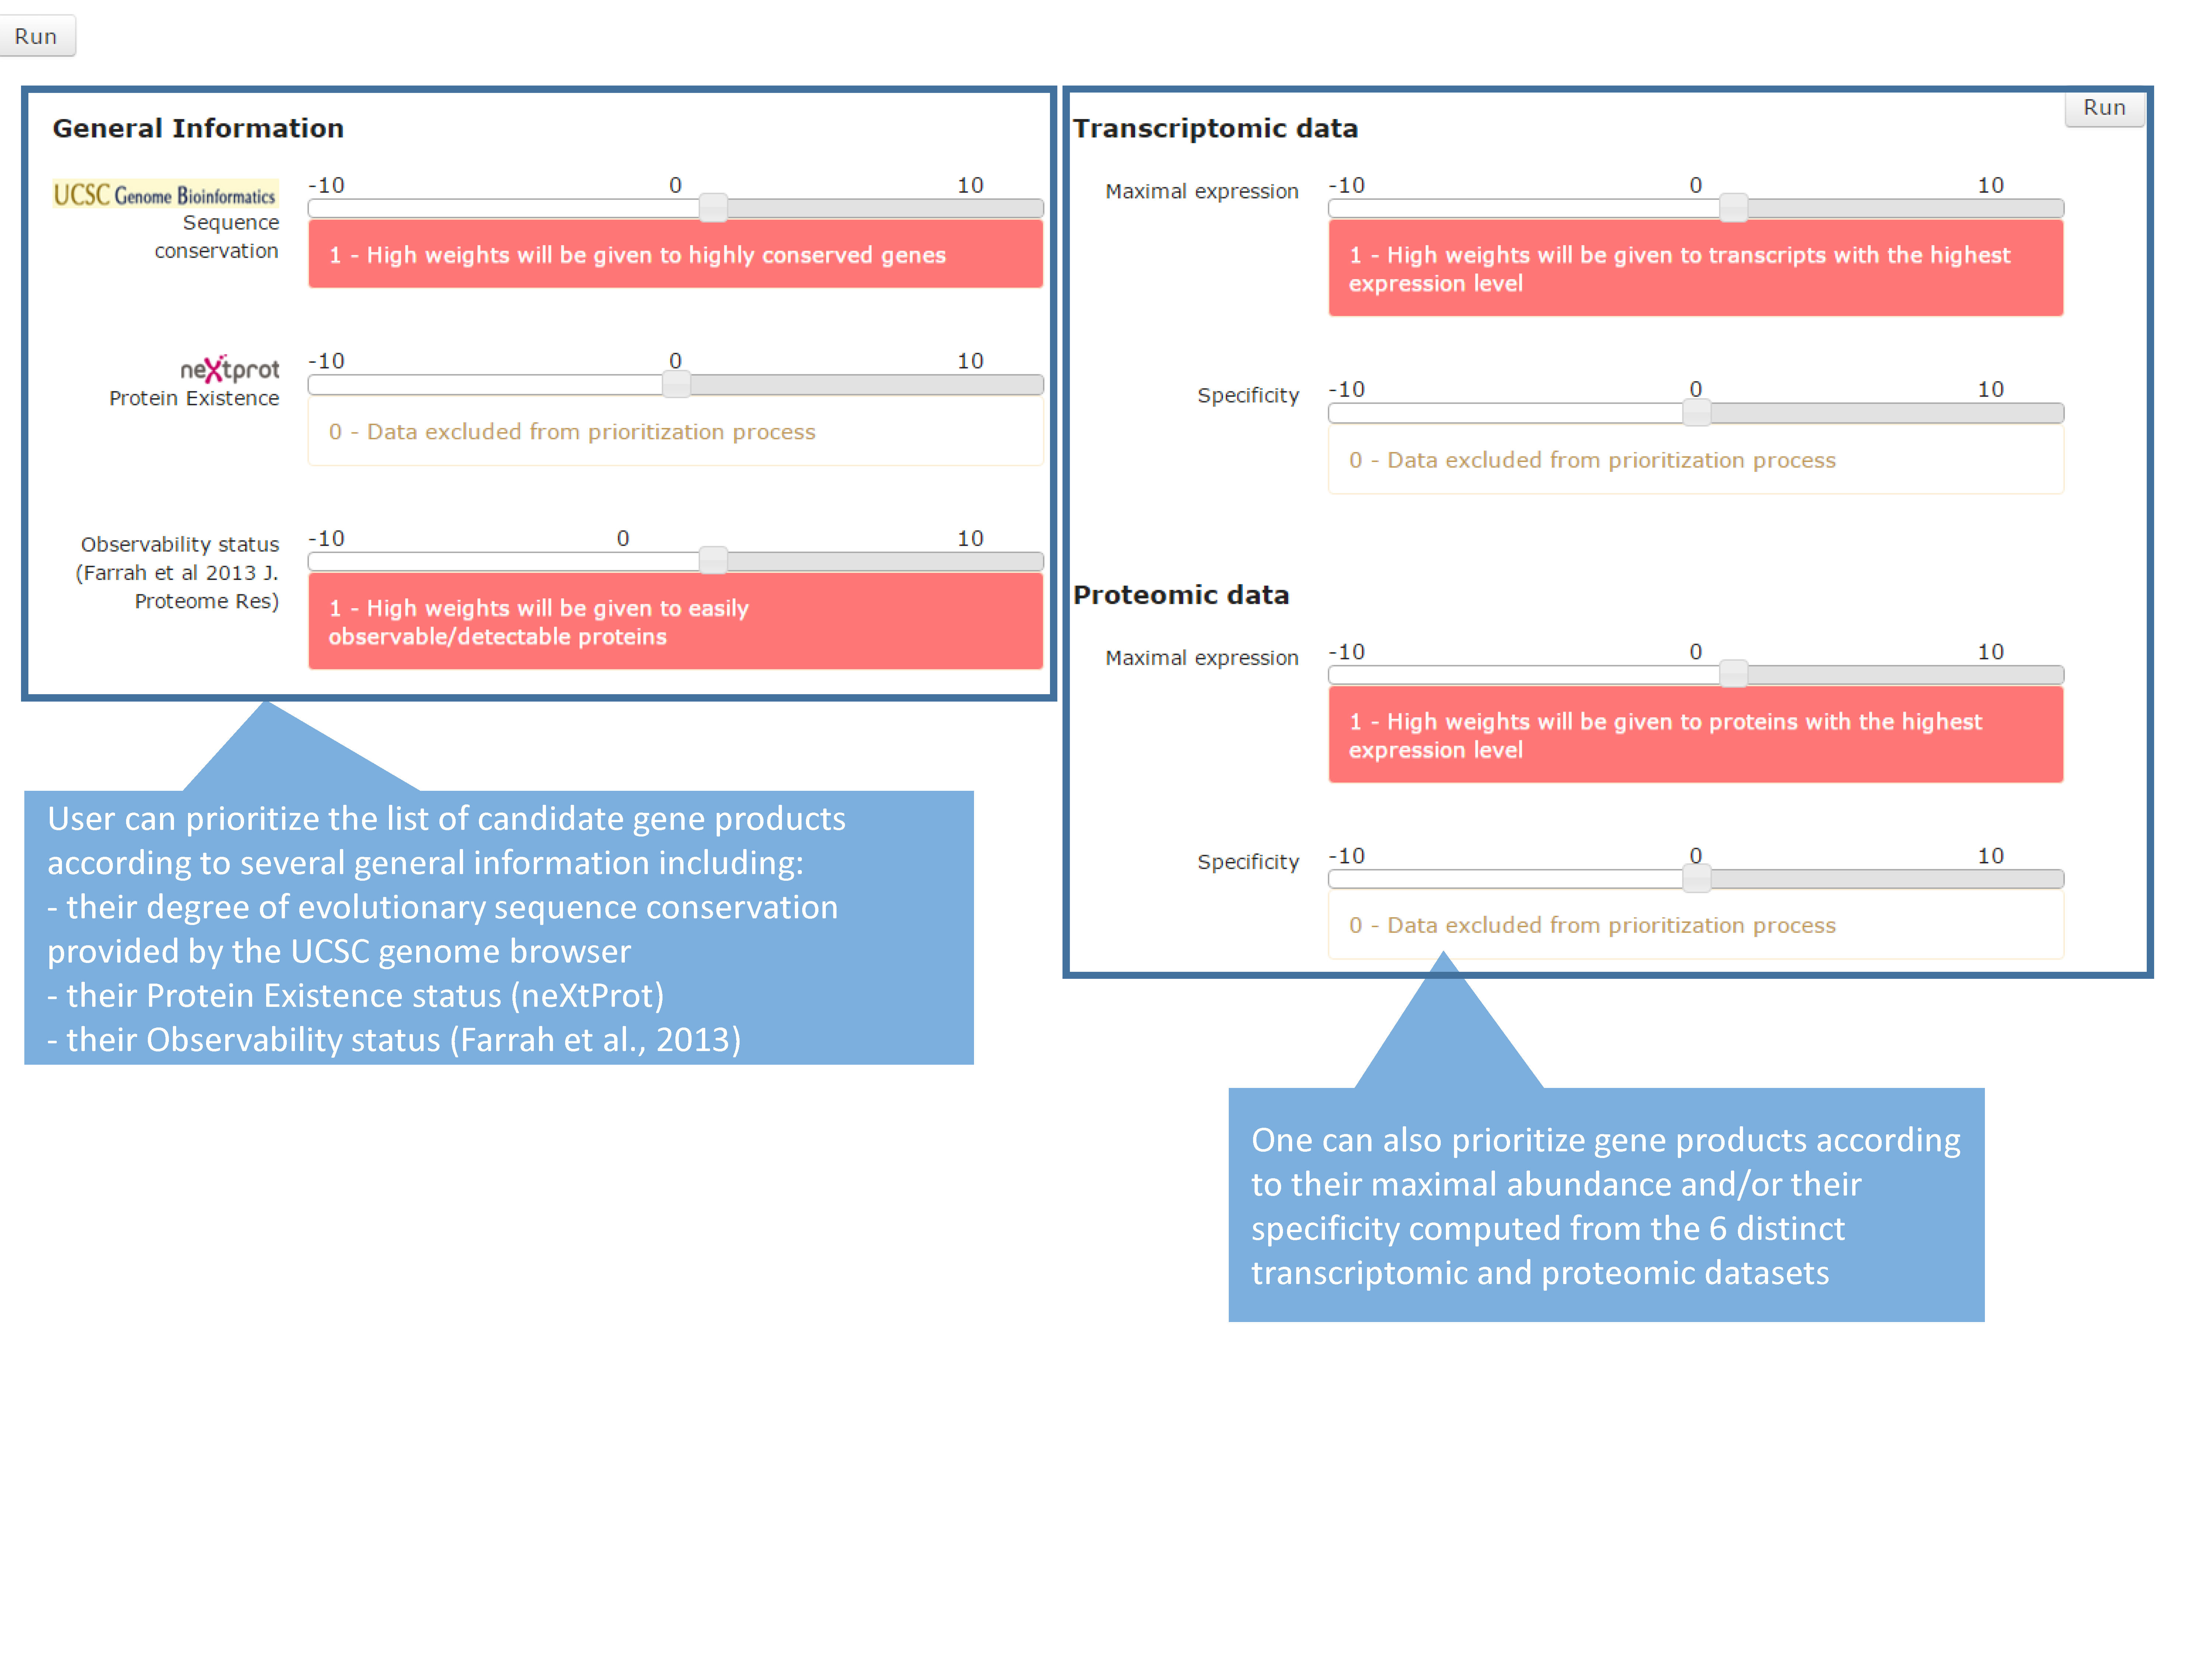
The “Prioritization” tab provides a direct access to seven different ranking modules organized into three categories, i.e. General Information, Transcriptomic data and Proteomic data.
The General Information category contains three modules which allow to obtain a ranked list of the neXtProt entries according to: (i) their degree of evolutionary sequence conservation across vertebrate genomes by averaging the base-by-base phastCons conservation scores calculated among 100 species as provided by the UCSC genome browser (Karolchik et al., 2014); (ii) their neXtProt PE status; and, (iii) their observability status as defined by Farrah and collaborators (Farrah et al., 2013).
Both Transcriptomic data and Proteomic data categories include two modules, Maximal expression and Specificity, which rank neXtProt gene products according to their maximal abundance at the (iv) transcript- and (v) protein-levels by using the transcriptomic and proteomic datasets described in the “Filtration” tab; and to their restricted expression pattern across human tissues at the (vi) transcript- and (vii) protein-levels as defined by the Shannon entropy Q (categorical) (Britto et al., 2012; Schug et al., 2005).
Importantly, the interface enables users to apply higher or lower weights to each prioritization module thus increasing or decreasing its contribution to the final ranking algorithm. By taking the weight applied to the Sequence conservation module as an example: a high positive weight (from +1 to +10) will tend to give high importance in the overall ranking to neXtProt entries associated with protein sequence conserved across vertebrate species; a low negative weight (from -10 to -1) will give a high final rank to gene products with a low sequence conservation; finally, a weight of 0 means that this module will be not taken into account to compute the overall ranking. Another example: a high positive weight (from +1 to +10) to the Specificity module of the Proteomics data category will tend to give a better ranking to gene products displaying an expression at the protein-level (based on the antibody-based and LC-MS/MS-based proteomic datasets) restricted to only few human tissues than to gene products ubiquitously detected in all organs.
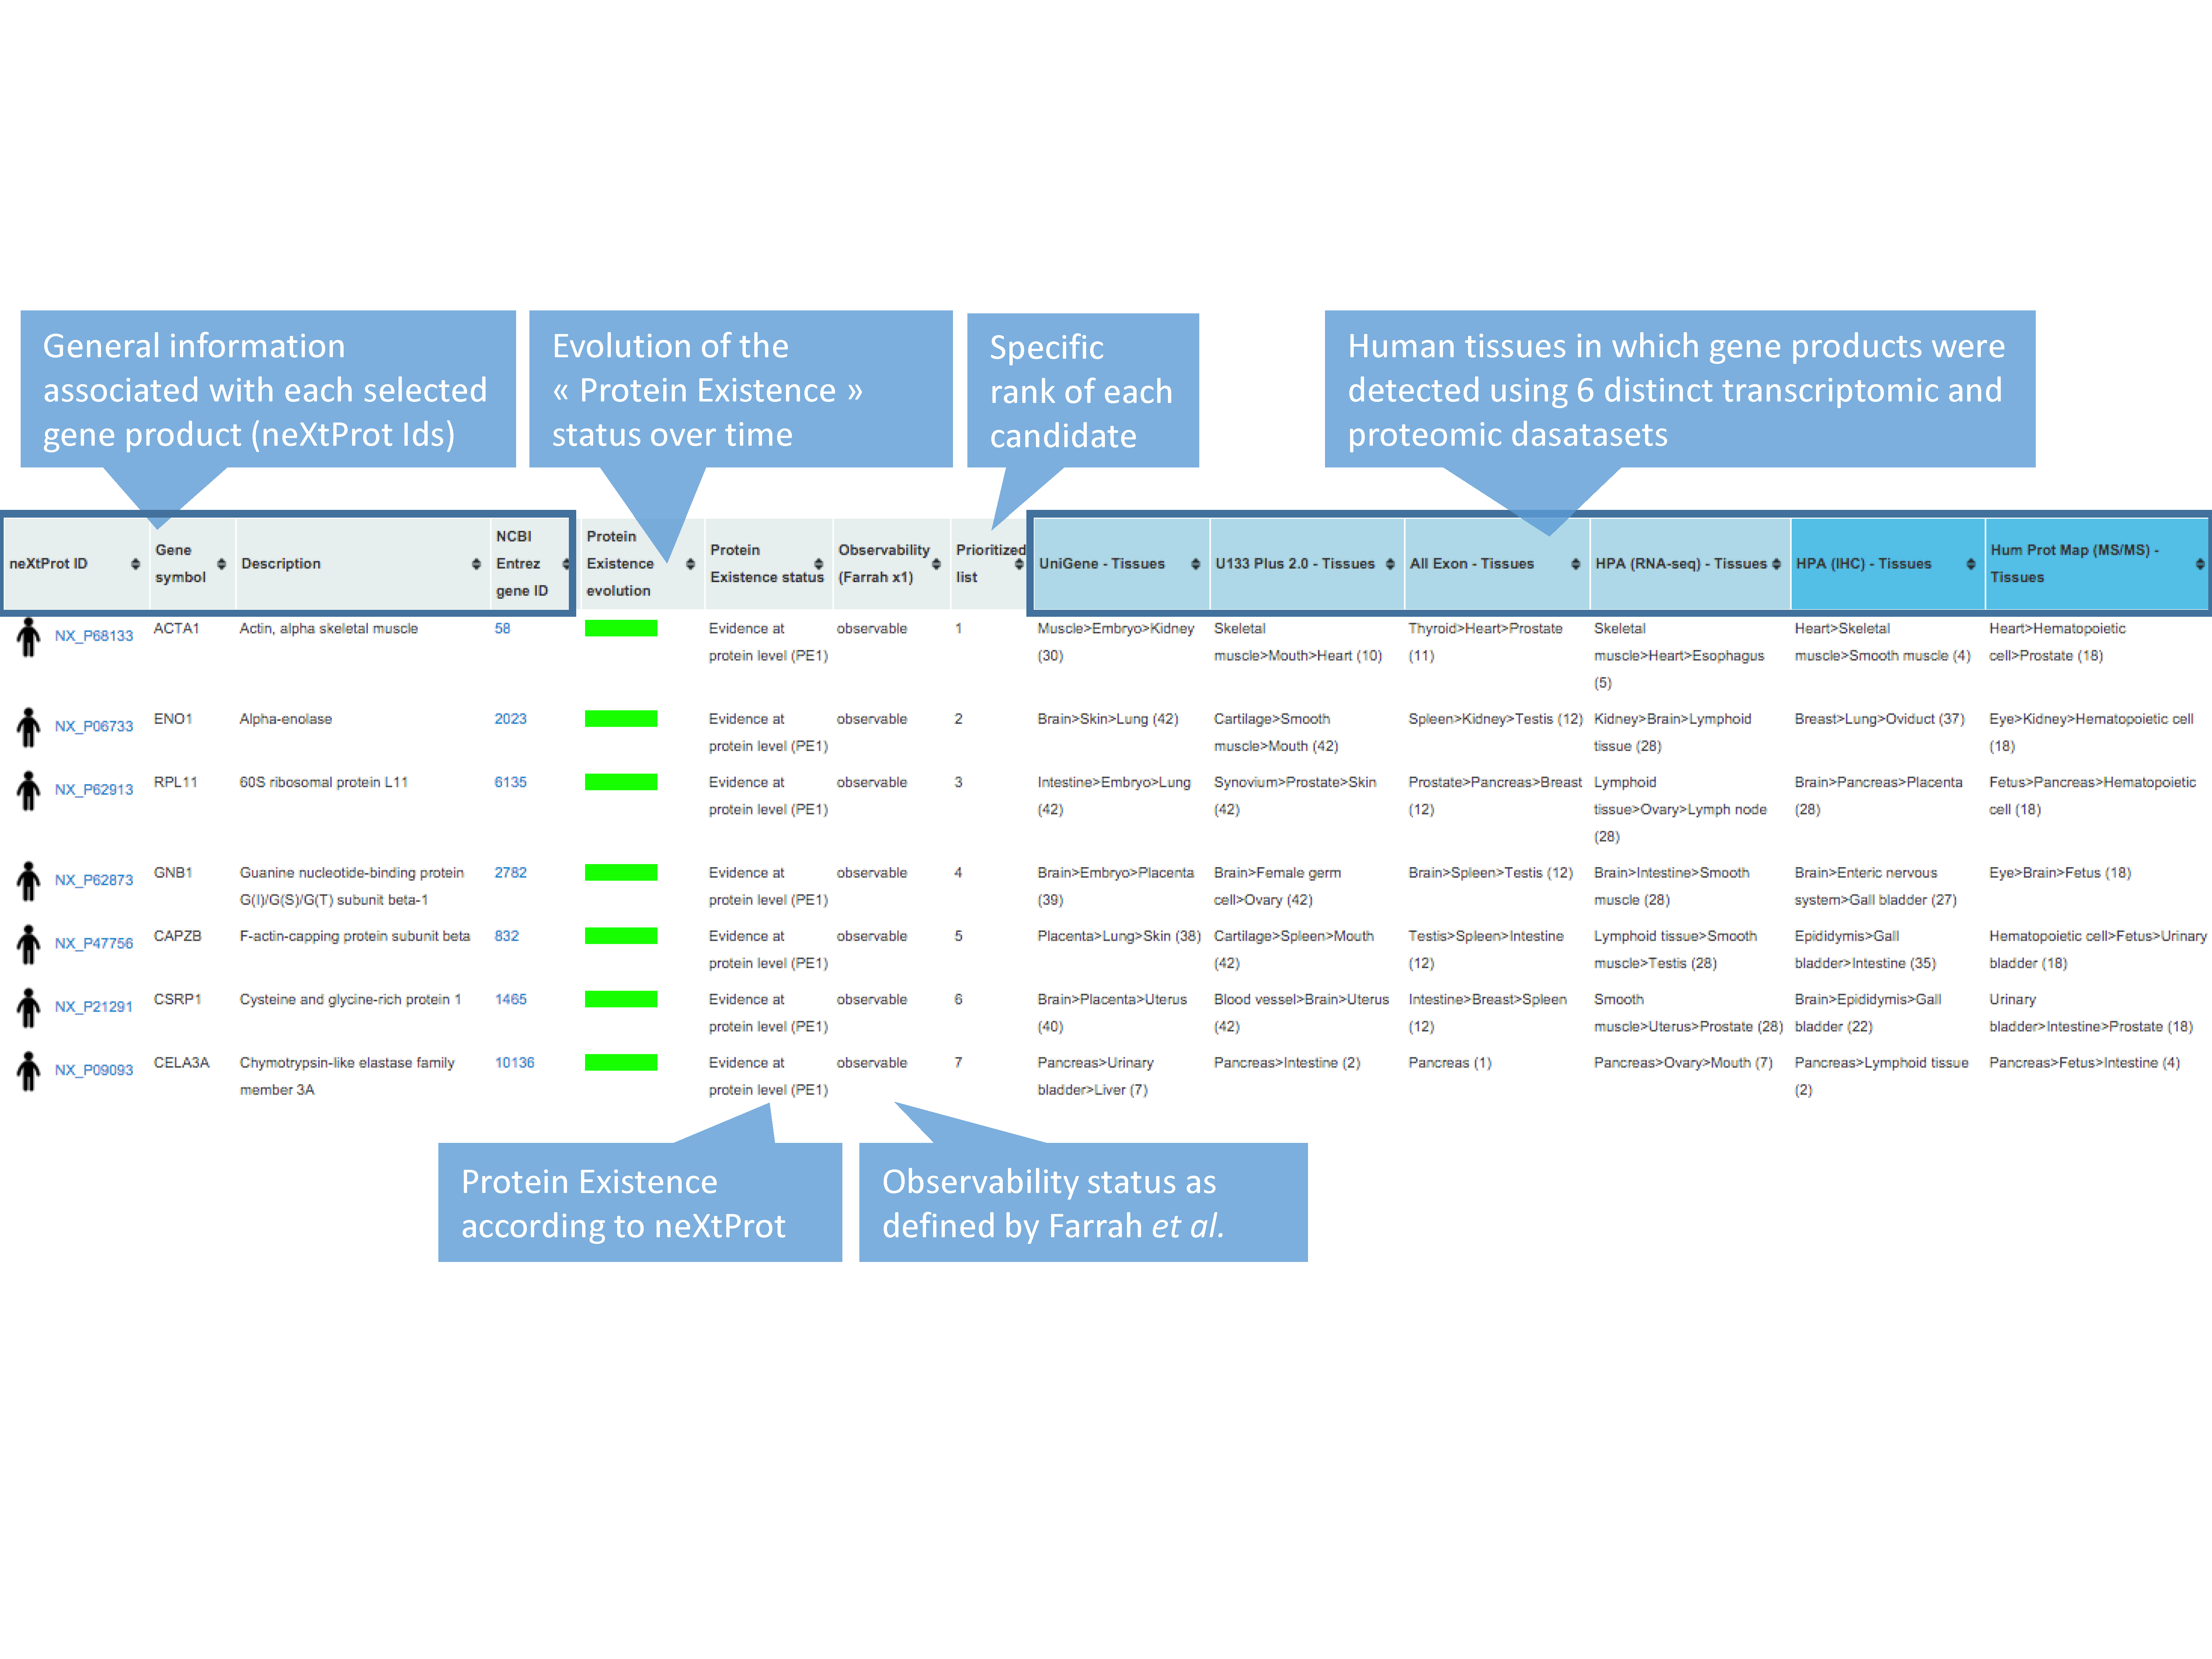
The output page displays the top 20 neXtProt entries but users can change this setting as they deem appropriate. The result is displayed in the form of a table containing one protein entry per line with columns for: neXtProt IDs (hyperlinked to the neXtProt knowledgebase); gene symbols and protein descriptions; NCBI Entrez gene IDs (hyperlinked to the NCBI website); the color-coded evolution of the neXtProt PE status over time (Lane et al., 2014); the current PE status; the observability status (Farrah et al., 2013); the rank of each neXtProt entry computed by the PepPSy prioritization system based on the weight scheme defined by the user; and the human tissues in which the corresponding gene products display the highest abundance based on the six distinct transcriptomic and proteomic datasets (NCBI-UniGene, Affymetrix 3’ array and All Exon, Illumina RNA sequencing, HPA antibody-based and HPM LC/MS-based protein expression profiles). Results can be exported as an archive file containing both a complete (full) and a lighter (light) text files (tabular format) reporting the entire protein list and corresponding ranking information via a “click here” link at the top of the page and subsequently imported into an Excel sheet.
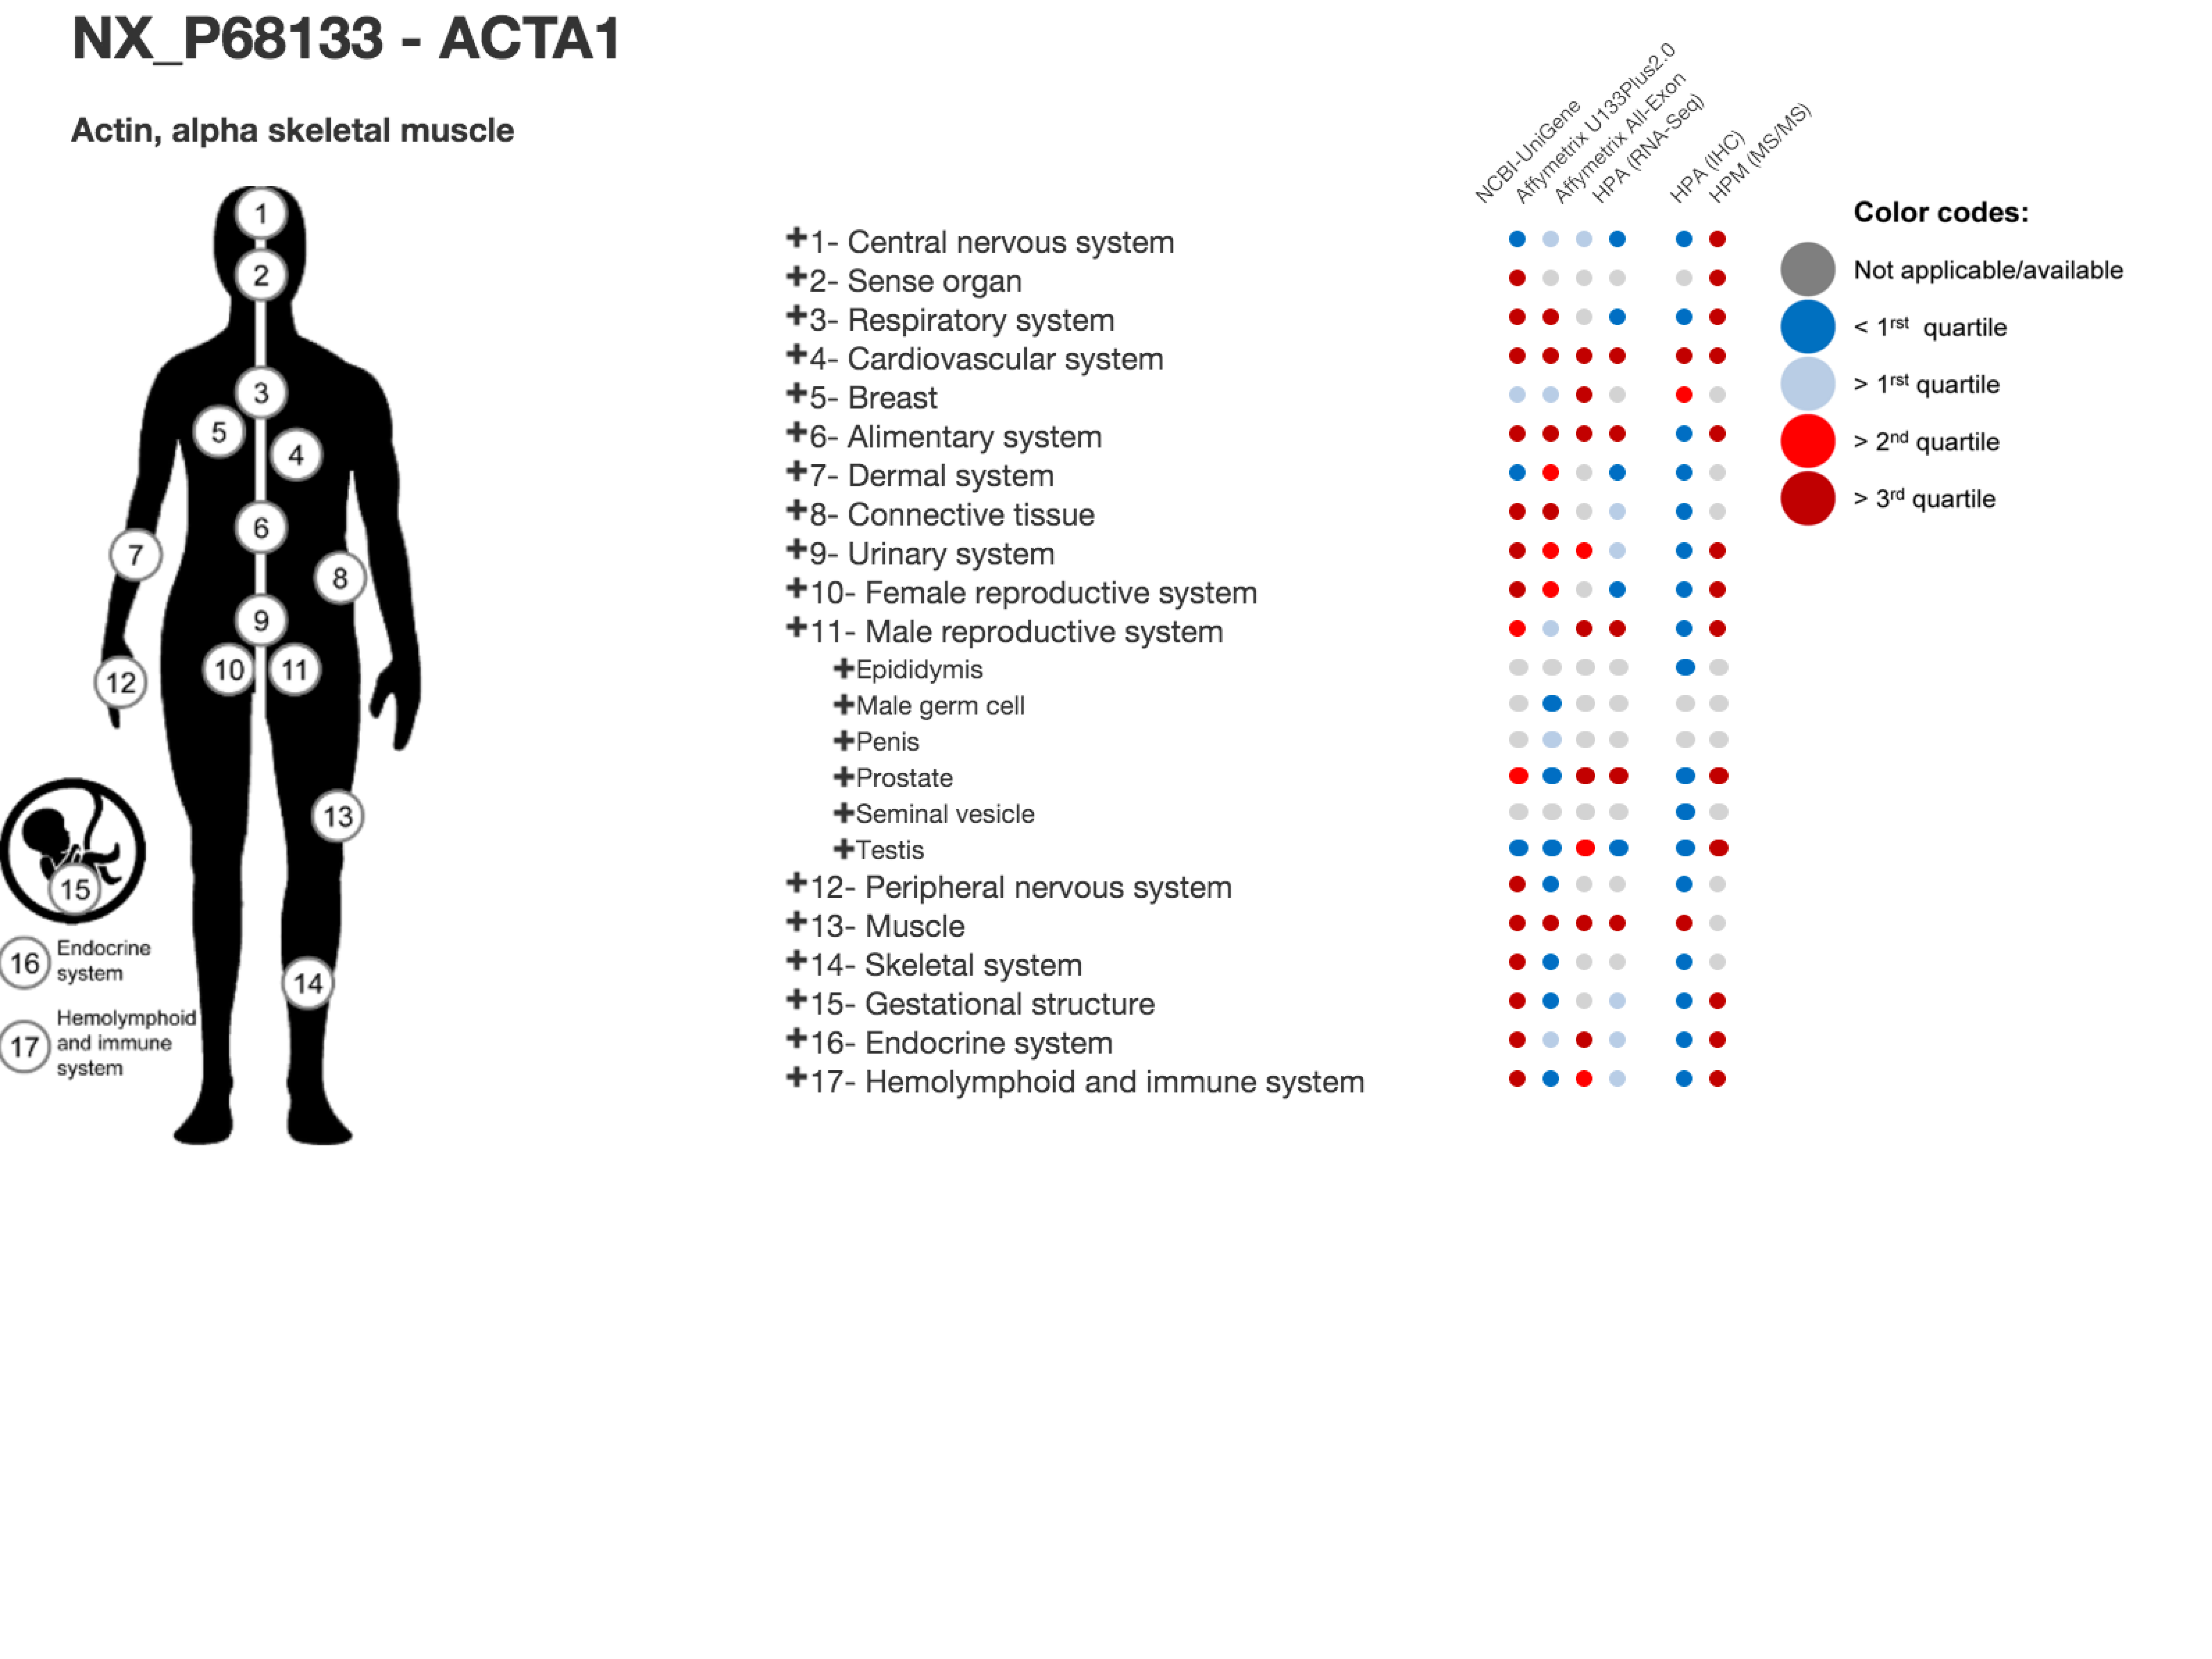
In addition to the output table, a graphical interactive interface, called Body map, is conveniently available by clicking on the stickman to the left of each neXtProt entry. This tool may help users to summarize and explore the current knowledge regarding the expression at the transcript- and protein-level of each individual gene product in all major tissues of the human body through the six transcriptomic and proteomic technologies hosted in the system. Briefly, a menu on the right side contained 3 levels in which HECs (level 3, blue and italic font style) are organized in human tissues/organs (level 2) classified in major systems of the human body (level 1). Human systems, tissues and HECs are color-coded according to the expression levels of the considered gene product, measured by the six transcriptomic and proteomic technologies and displayed as first, second and third quartile values.
Modules, ranking and overall prioritization. The integration of genome datasets with distinct ranking strategies forms the basis of PepPSy’s modular architecture allowing for maximum query flexibility. In PepPSy, the precomputation of module-wise ranks greatly accelerates the process of prioritization. To combine the ranking output of each individual module, the absolute rank of each neXtProt entry in a ranked list is transformed into relative ranks. When the system is queried, candidate protein entries in the input list are mapped onto the pre-computed ranked lists. An overall rank of a given neXtProt entry is computed based on an inter-module weighted average of the individual module ranks. The final output is a reordered list based on the overall ranking of each protein entry.
Technical issues and updates. Above the PepPSy database generated by Python and Tcl/Tk scripts, there is a web application implemented in PHP with the Symfony framework. The application indexes the input files using the Lucene library. This index allows to search in the whole elements with multiple input cross parameters. When user selects information, the application searches in the index for matching gene product identifiers and calls the Tcl/Tk scripts with the selected prioritization parameters and the matching proteins. Results (JSON format) are then returned and displayed as a table.
As PepPSy is closely related to the neXtProt knowledgebase, information for each gene product entry is updated and processed every time a novel neXtProt release is made available to the community. Note that PepPSy offers the possibility to query the system and to prioritize lists of gene products based on the information of the older neXtProt releases.